

Financial results for 2024
Given that Tallinna Vesi only operates in Estonia, it is natural that our company is mainly dependent on the trends in Estonian economy. According to the Estonian Economy and Monetary Policy review prepared by Eesti Pank, the year proved harder than expected for the Estonian economy and the recession lasted longer than predicted. Changes in the consumer price and construction price indices have a direct impact on Tallinna Vesi’s operating costs and investments.
Main financial indicators of Tallinna Vesi
€ million, except key ratios and share data
| 2024 | 2023 | 2022 | 2021 | 2020 | |
|---|---|---|---|---|---|
| Sales | 64.38 | 61.14 | 54.56 | 53.29 | 51.72 |
| Gross profit | 26.67 | 24.07 | 16.90 | 20.58 | 22.23 |
| Operating profit before depreciation and amortisation (EBITDA) | 27.51 | 25.40 | 18.14 | 25.30 | 28.07 |
| Operating profit | 18.98 | 17.35 | 11.32 | 18.78 | 21.78 |
| Profit before taxes | 14.78 | 14.21 | 10.65 | 18.40 | 21.34 |
| Net profit | 13.28 | 12.84 | 8.41 | 16.17 | 16.73 |
| Gross profit margin, % | 41.43 | 39.36 | 30.97 | 38.61 | 42.98 |
| EBITDA margin, % | 42.73 | 41.55 | 33.24 | 47.47 | 54.27 |
| Operating profit margin, % | 29.49 | 28.38 | 20.75 | 35.24 | 42.12 |
| Profit before taxes margin, % | 22.96 | 23.23 | 19.51 | 34.52 | 41.27 |
| Net profit margin, % | 20.63 | 21.01 | 15.41 | 30.33 | 32.35 |
| ROA, % | 4.46 | 4.80 | 3.30 | 6.32 | 6.45 |
| Debt to total assets, % | 61.71 | 58.47 | 56.26 | 54.94 | 56.09 |
| ROE, % | 11.20 | 11.27 | 7.43 | 14.20 | 14.69 |
| Current ratio | 0.76 | 1.30 | 1.24 | 2.83 | 3.85 |
| Number of full-time equivalent employees, at the end of the year | 362 | 351 | 333 | 333 | 332 |
| Share price, at the end of the year | 10.20 | 10.60 | 12.54 | 14.48 | 13.25 |
| Share capital | 12.00 | 12.00 | 12.00 | 12.00 | 12.00 |
| Earnings per share | 0.66 | 0.64 | 0.42 | 0.81 | 0.84 |
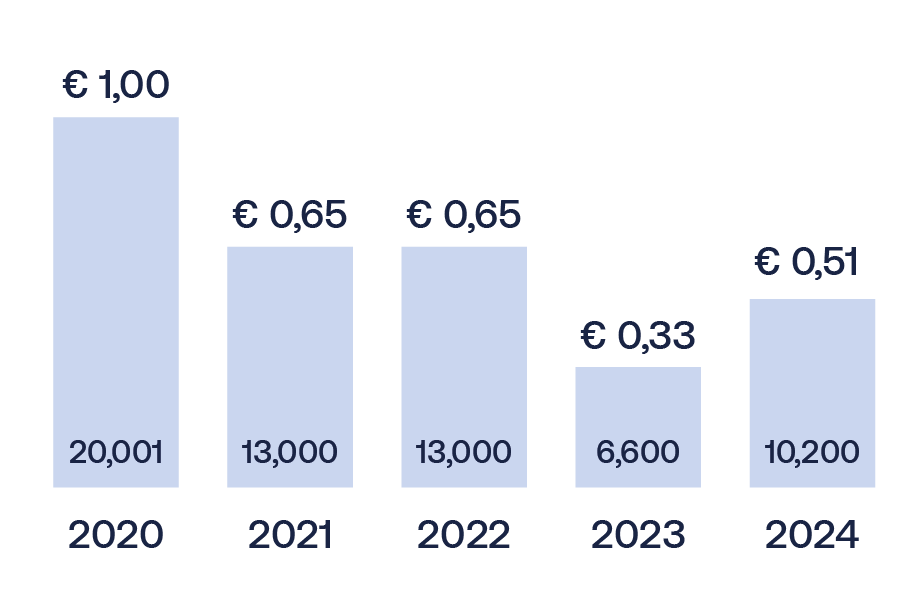
| Dividend per share | n/a* | 0.51 | 0.33 | 0.65 | 0.65 |
| Cash balance, at the end of the year | 3.59 | 14.74 | 12.65 | 36.56 | 44.51 |
| Investments to fixed assets | 49.53 | 34.93 | 25.13 | 15.38 | 19.42 |

During the twelve months of 2024 the group’s total sales were €64.38 million, showing an increase of 5.3% or €3.24 million year-on-year. Sales from water services for twelve months of 2024 were €58.29 million, increasing by 4.8% or €2.67 million year-on-year. Sales from water services both inside and outside of the main service area accounted for 90.6% of the group's total revenue, 8.1% of the sales accounted for construction services and 1.3% for other services.
Sales
€ thousand
Variance 2024/23
| 2024 | 2023 | 2022 | EUR | % | |
|---|---|---|---|---|---|
| Water supply service | 11,714 | 9,861 | 8,380 | 1,853 | 18.8% |
| Wastewater disposal service | 15,207 | 14,508 | 12,406 | 699 | 4.8% |
| Total from private customers | 26,921 | 24,369 | 20,786 | 2,552 | 10.5% |
| Water supply service | 8,245 | 8,514 | 8,260 | -269 | -3.2% |
| Wastewater disposal service | 8,988 | 9,087 | 8,480 | -99 | -1.1% |
| Total from business customers | 17,233 | 17,601 | 16,740 | -368 | -2.1% |
| Water supply service | 1,733 | 1,670 | 1,599 | 63 | 3.8% |
| Wastewater disposal service | 4,875 | 4,236 | 3,525 | 639 | 15.1% |
| Stormwater disposal service | 168 | 260 | 193 | -92 | -35.4% |
| Total from outside service area customers | 6,775 | 6,166 | 5,317 | 609 | 9.9% |
| Stormwater disposal and fire hydrants service | 5,849 | 6,011 | 4,643 | -162 | -2.7% |
| Excess pollution charges and sewer discharge service | 1,514 | 1,476 | 1,403 | 38 | 2.6% |
| Total from water services | 58,291 | 55,624 | 48,890 | 2,667 | 4.8% |
| Construction services | 5,220 | 4,775 | 4,809 | 445 | 9.3% |
| Other services | 865 | 742 | 860 | 123 | 16.6% |
| Total revenue | 64,377 | 61,141 | 54,558 | 3,236 | 5.3% |
Cost of goods and services sold and gross and operating profits
€ thousand
Variance 2024/23
| 2024 | 2023 | 2022 | EUR | % | |
|---|---|---|---|---|---|
| Water abstraction charges | -1,282 | -1,271 | -1,288 | -11 | -0.9% |
| Chemicals | -2,865 | -2,742 | -2,238 | -123 | -4.5% |
| Electricity | -4,690 | -6,408 | -9,234 | 1,718 | 26.8% |
| Pollution tax | -1,024 | -1,005 | -823 | -19 | -1.9% |
| Total direct production costs | -9,861 | -11,426 | -13,583 | 1,565 | 13.7% |
| Staff costs | -10,718 | -9,684 | -8,229 | -1,034 | -10.7% |
| Depreciation and amortisation | -7,448 | -7,002 | -5,930 | -446 | -6.4% |
| Construction services | -4,084 | -3,481 | -3,784 | -603 | -17.3% |
| Other costs | -5,594 | -5,480 | -6,134 | -114 | -2.1% |
| Other costs of goods/services sold total | -27,844 | -25,647 | -24,077 | -2,197 | -8.6% |
| Total cost of goods/services sold | -37,705 | -37,074 | -37,660 | -631 | -1.7% |
Financial expenses
The group’s net financial income and expenses have resulted in a net expense of €4.20 million, compared to net expense of €3.14 million in the twelve months of 2023. The increase was mainly impacted by higher loan balance.
At the end of 2024, the entire loan balance of €118 million was at floating rates.
Profit before taxes and net profit
The group’s profit before taxes for the twelve months of 2024 was €14.78 million, being 4.0% or €0.57 million higher than for the same period in 2023. The group’s net profit for the twelve months of 2024 was €13.28 million, being 3.4% or €0.44 million higher than for the equivalent period in 2023, impacted by the €0.11 million higher income tax expense due to higher dividend payout.
Statement of financial position
In the twelve months of 2024, the group invested into fixed assets €49.53 million. As of 31/12/2024, non-current tangible assets amounted to €296.26 million, the majority of which in the amount of €231.78 million were pipelines (31/12/2023: €206.04 million). Total non-current assets amounted to €296.33 million (31/12/2024: €257.40 million).
Compared to the year-end of 2023, the trade receivables, accrued income, and prepaid expenses at the end of the 4th quarter were €10.75 million. The collectability rate remains high at 99.62%, similar to 99.78% at the end of December 2023. Current liabilities have increased by €1.76 million to €20.54 million compared to the end of 2023, mainly due to liabilities related to investments.
Deferred income from connection fees has increased by €5.45 million compared to the end of 2023, reaching €50.11 million. Provision for possible third-party claims is of the same size as at the end of December 2023, i.e. €6.02 million. More detailed information about the provision is presented in Note 13.
The group’s outstanding loans amount to €118 million (31/12/2023: €96.82 million). The NIB loan taken in 2019 is being repaid in 11 equal semi-annual payments. The changes to the loan structure are described above under "Financial expenses".
The group has total debt to assets level of 61.71%, which falls in the range of 54–65%, reflecting the group’s equity profile. At the same time in 2023, the total debt to assets ratio was 57.42%.
Investors

We aim to be transparent and honest through our business activities, giving timely and accurate information to our shareholders. We treat all our shareholders equally and are dedicated to efficiency while ensuring the sustainability of the company.
Investor communication
Tallinna Vesi is a listed company and its shares have been listed on Nasdaq Baltic Stock Exchanges since 1 June 2005. A company’s market value is a good indication of the overall value of the company and the investors’ perceptions of its business prospects. Market value is affected not only by factors controlled by the company, but also by those which cannot be controlled. Profitability and cost effectiveness are major influences on market value and can be controlled by the Management Board of the company.
Continuing and transparent communication is one of the main factors in maintaining excellent investor relations. Therefore, we continue to regularly communicate our targets, strategy and performance to the investors as well as to all other stakeholders. Each quarter, we introduce the company’s quarterly financial results to the investors and take part in discussions on the webinars. Additionally, we hold regular meetings between key institutional shareholders and potential investors and the company’s Management Board. All shareholders are welcome to ask questions from the members of the Management Board and the Supervisory Council directly at the Annual General Meeting of Shareholders and at all times using e-mail or telephone.
We have worked hard on our investor relations programme since the listing of Tallinna Vesi on the Tallinn Stock Exchange and will continue to do so in the following years. To maintain the transparency of our Management Board’s activities to shareholders, we have reported on Corporate Governance Recommendations on a regular basis since 2006.
Dividends
Dividend allocation to the shareholders is recorded as a liability in the financial statement of the company at the time when the profit allocation and dividend payment is confirmed by the Annual General Meeting of Shareholders.
Every year, the Supervisory Council evaluates, taking into account all the circumstances, the proposal for the dividend to be paid to shareholders and approves it to be presented for a vote by the Annual General Meeting of Shareholders.
In the Annual General Meeting of Shareholders held on 30/05/2024, the Supervisory Council proposed to pay out €0.51 per share from the 2023 profits. The pay-out is equal to 79% of earnings in 2023. The proposal was approved by the Annual General Meeting.
Tallinna Vesi aims to distribute 50–80% of the annual profit as dividends. Dividend payments are assessed annually considering the company’s earnings, investment needs, liquidity position and long-term financial targets.
Share performance
Tallinna Vesi is listed on Nasdaq Baltic Main List with trading code TVEAT and ISIN EE3100026436.
As of 31/12/2024, Tallinna Vesi’s shareholders, with a direct holding over 5%, were:
City of Tallinn (55.06%)
OÜ Utilitas (20.36%)
During the 12 months of 2024, the local retail investors and institutional investors have increased their shareholdings by 0.06% and 0.10% respectively, while the proportion of foreign institutional investors has decreased by 0.15% and the proportion of foreign retail investors has decreased by 0.01%.
As of 31/12/2024, the closing price of Tallinna Vesi’s share was €10.20, which is 3.77% lower compared to the price of €10.60 at the beginning of the year (2023: -15.74%). OMX Tallinn index decreased by -2.01% (2023: +0.1%).
During 2024, 15,515 transactions were made with the company’s shares (2023: 19,918 transactions), during which 382 thousand shares or 1.9% of all shares changed hands (2023: 504 thousand shares or 2.5%).
The turnover of transactions in 12 months of 2024 amounted to €3.96 million, being €1.94 million lower than in the comparative period in 2023.
Activities of the subsidiary Watercom OÜ
Watercom has been established by AS Tallinna Vesi in 2010.
From the beginning, Watercom's main activities have been the maintenance and construction of water and wastewater pipelines and related activities, and in recent years also road construction. Watercom's activities support the operations of Tallinna Vesi, its main customer, on a daily basis. In addition to Tallinna Vesi, the company's customers include a number of local authorities, other water companies, developers and general contractors. The company operates mainly in Tallinn and Harju County, but has also carried out some construction projects in other parts of Estonia.
Watercom’s activities include:
pipeline construction,
road construction,
road maintenance services,
pipeline maintenance services,
project management and owner supervision,
transport services.
Watercom’s main objectives and development directions for 2025
2024 was a successful year for Watercom. Despite the difficult situation in the infrastructure market, Watercom ended the year as a standalone company with only slightly lower sales and profit than in 2023. In recognition of the good results, the company was ranked 11th overall in the TOP infrastructure builders and topped the ranking of successful water, gas and sewer pipeline builders compiled by the Äripäev business daily in 2024. The company is working to maintain a similar pace in 2025. This is underpinned by the volume of work already won in the pipeline and road construction markets in the second half of 2024, as well as an increasing number of tenders and requests for quotations, indicating a slight recovery in the construction market. Pipeline construction was the main contributor to achieving the targets set for the year. At the end of 2024, new equipment was purchased to enable sewer renovation using a no-dig method. The company plans to use this to increase the volume of work it carries out itself and to start actively offering this service in the new year. The company has also renewed its fleet with the purchase of new tip lorries and a pressure washing truck. The outlook for 2025 remains positive and the company is committed to finding new ways to grow its revenues and profits from services won in the market. The company will continue to explore new opportunities for further growth through the development and launch of new services.
Pipeline and road construction
Watercom’s main activity in 2024 was the construction of water and wastewater pipelines for developers, general contractors, water companies and private individuals. As in previous years, the focus was on feasible construction projects and procurements in Tallinn and elsewhere in Estonia. The main customers for road construction services were various general contractors, road construction companies and local authorities.
2024 continued to be a rather challenging year for the construction sector, but the second half of the year saw some recovery in both the pipeline and road construction markets, leading to an increase in external construction sales compared to the previous year. Due to the highly competitive market for both services, it was difficult to maintain the profit margin for construction activities in 2024, resulting in lower profits from these activities than in the previous year.
Other services
Pipeline maintenance and transport services are mainly provided within the group, but are also available to external customers. The preventive jet washing program significantly reduced the number of sewer blockages compared to previous years. Sales were also positively influenced by the sale of water and wastewater network maintenance services provided to external customers.
The development of new services within and outside the group will continue in 2025.